
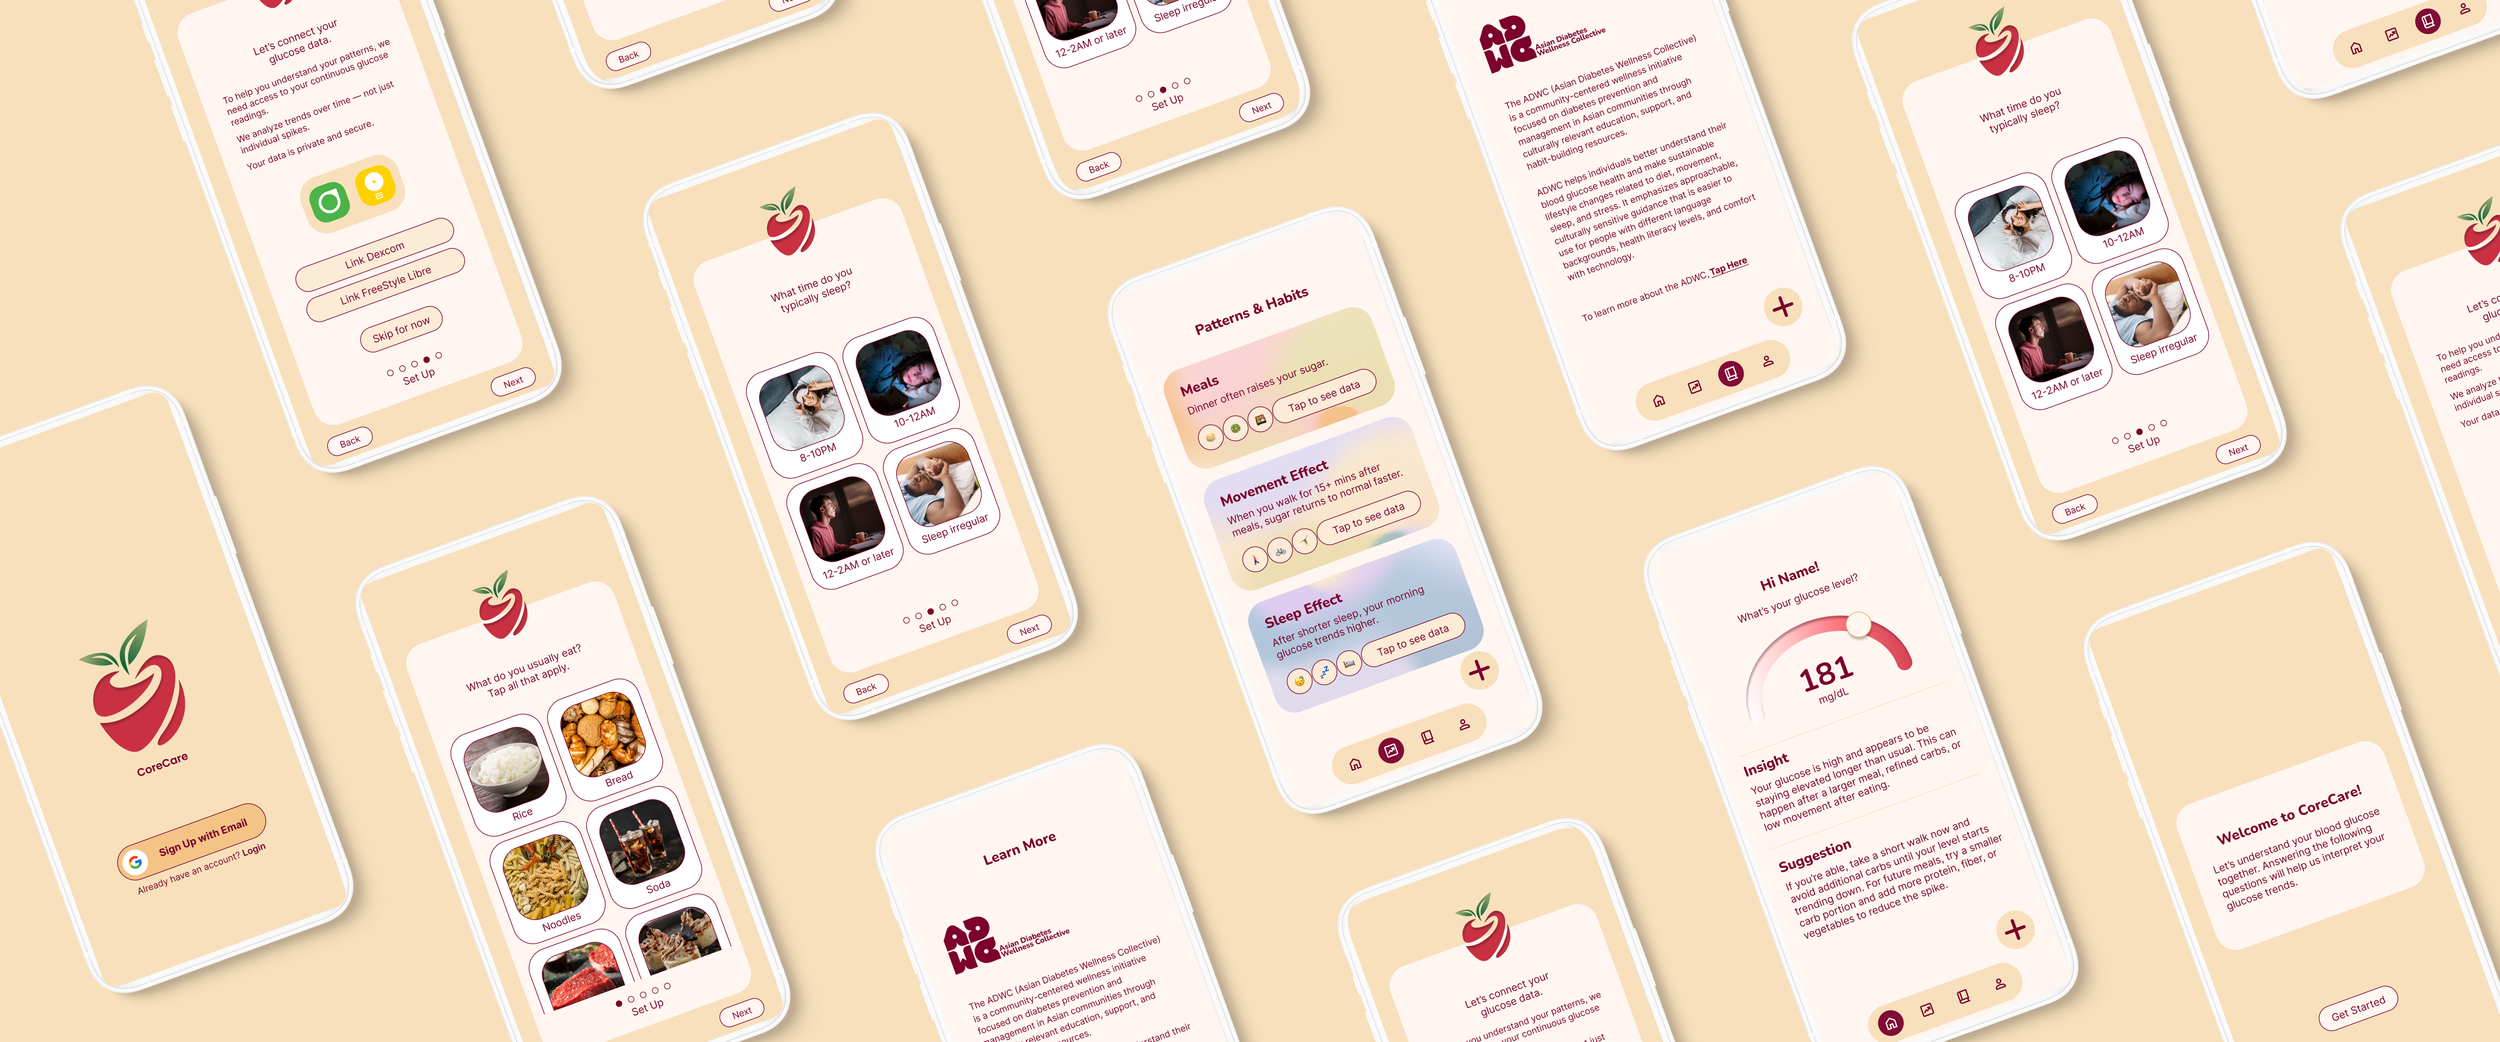
CoreCare | Making glucose data make sense.
01. OVERVIEW
Problem
In a collaborative project with the Asian Diabetes Wellness Collective (ADWC) and Boston College, I set out to address a gap in how people with continuous glucose monitors understand their own data. A raw mg/dL reading doesn't explain why it's high, what caused it, or what to do about it — and most CGM apps are built for logging, not for helping someone actually interpret or respond to their numbers in the moment.
A number on a screen doesn't tell you what to do next.
Solution
CoreCare turns raw readings into plain-language insight and next steps.
Its user-friendly interface presents each glucose reading alongside a plain-language insight and suggestion, allowing users to make meaningful sense of their CGM data at a glance. By pairing onboarding questions about a user's habits with direct CGM integration, CoreCare builds an accurate, user-specific picture of their patterns over time. Plus, a direct link to ADWC's resources keeps support going beyond the app itself.
Personalized
Built Around Your Habits
Before showing any data, CoreCare asks a few quick questions about a user's typical diet and sleep schedule. This serves as the foundation for every insight the app gives later, ensuring guidance reflects how someone actually lives, not a generic set of assumptions.
Immediate
Understand Your Glucose, Instantly
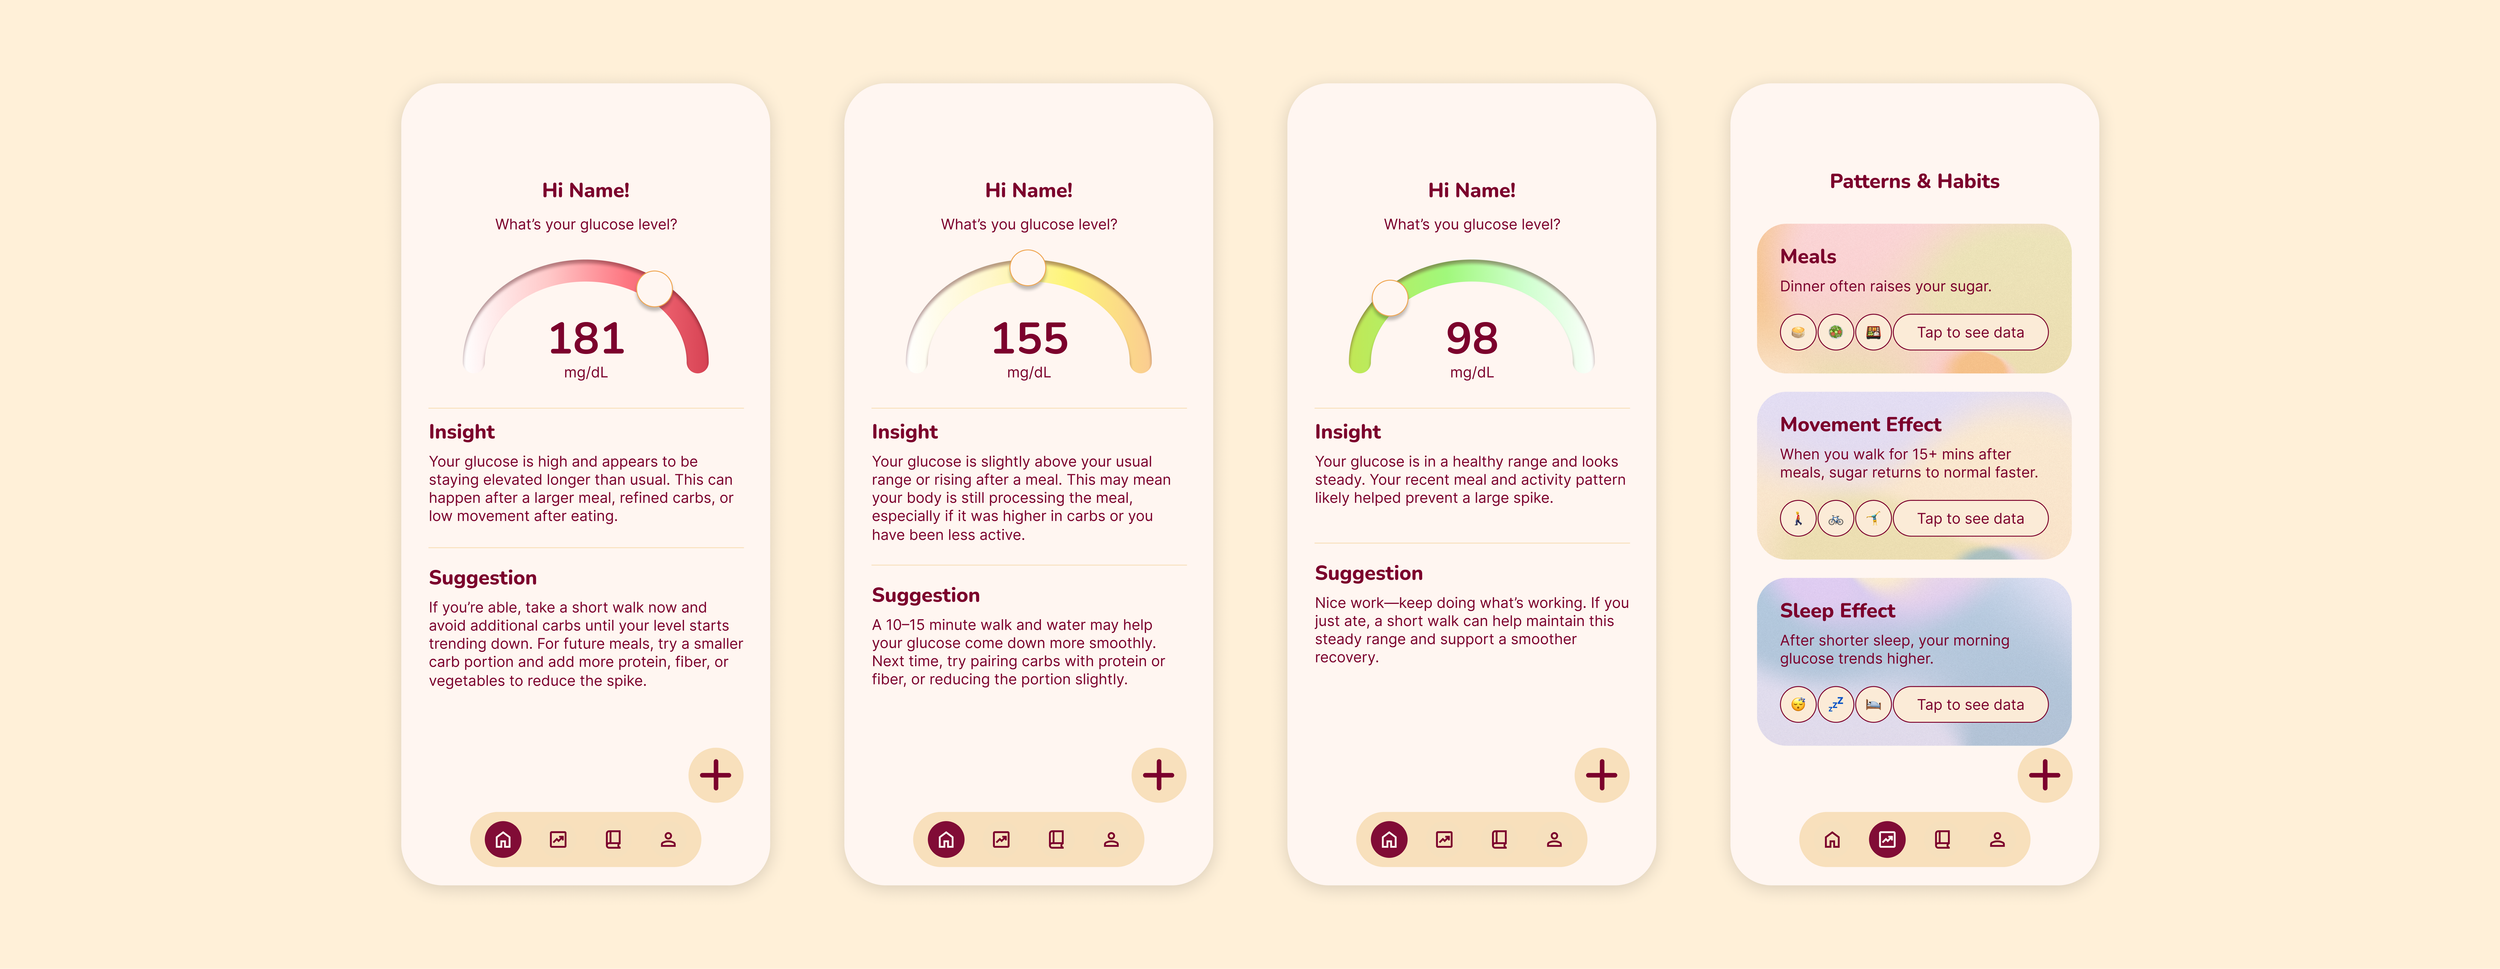
Users link their CGM data directly, and their current reading appears on the home screen alongside two things most apps skip: an insight explaining what's likely happening, and a suggestion for what to do about it now.
Long-Term
See What’s Actually Affecting You
The patterns & habits tab shows how everyday choices affect glucose over time, like how a late dinner tends to raise sugar or how a short walk afterward helps it recover faster. Instead of reacting to spikes as they happen, users start recognizing the habits behind them and can make small, sustainable changes over time.
02. RESEARCH
User Research
Understanding Current Methods & Pain Points
To design something that helps people interpret their glucose data, I first needed to understand how continuous glucose monitor (CGM) users check their numbers today, what they do with them, and where they get stuck.
To accomplish this, I interviewed four CGM users of Asian background, ages 45 to 52, in 20 to 30 minute online sessions, and collected four user diaries tracking when they checked their CGM and what they did next. Together, these showed us what people say and what they actually do. Grouping our notes into themes revealed a clear pattern: people have no trouble seeing their glucose data, but they struggle to turn it into action.
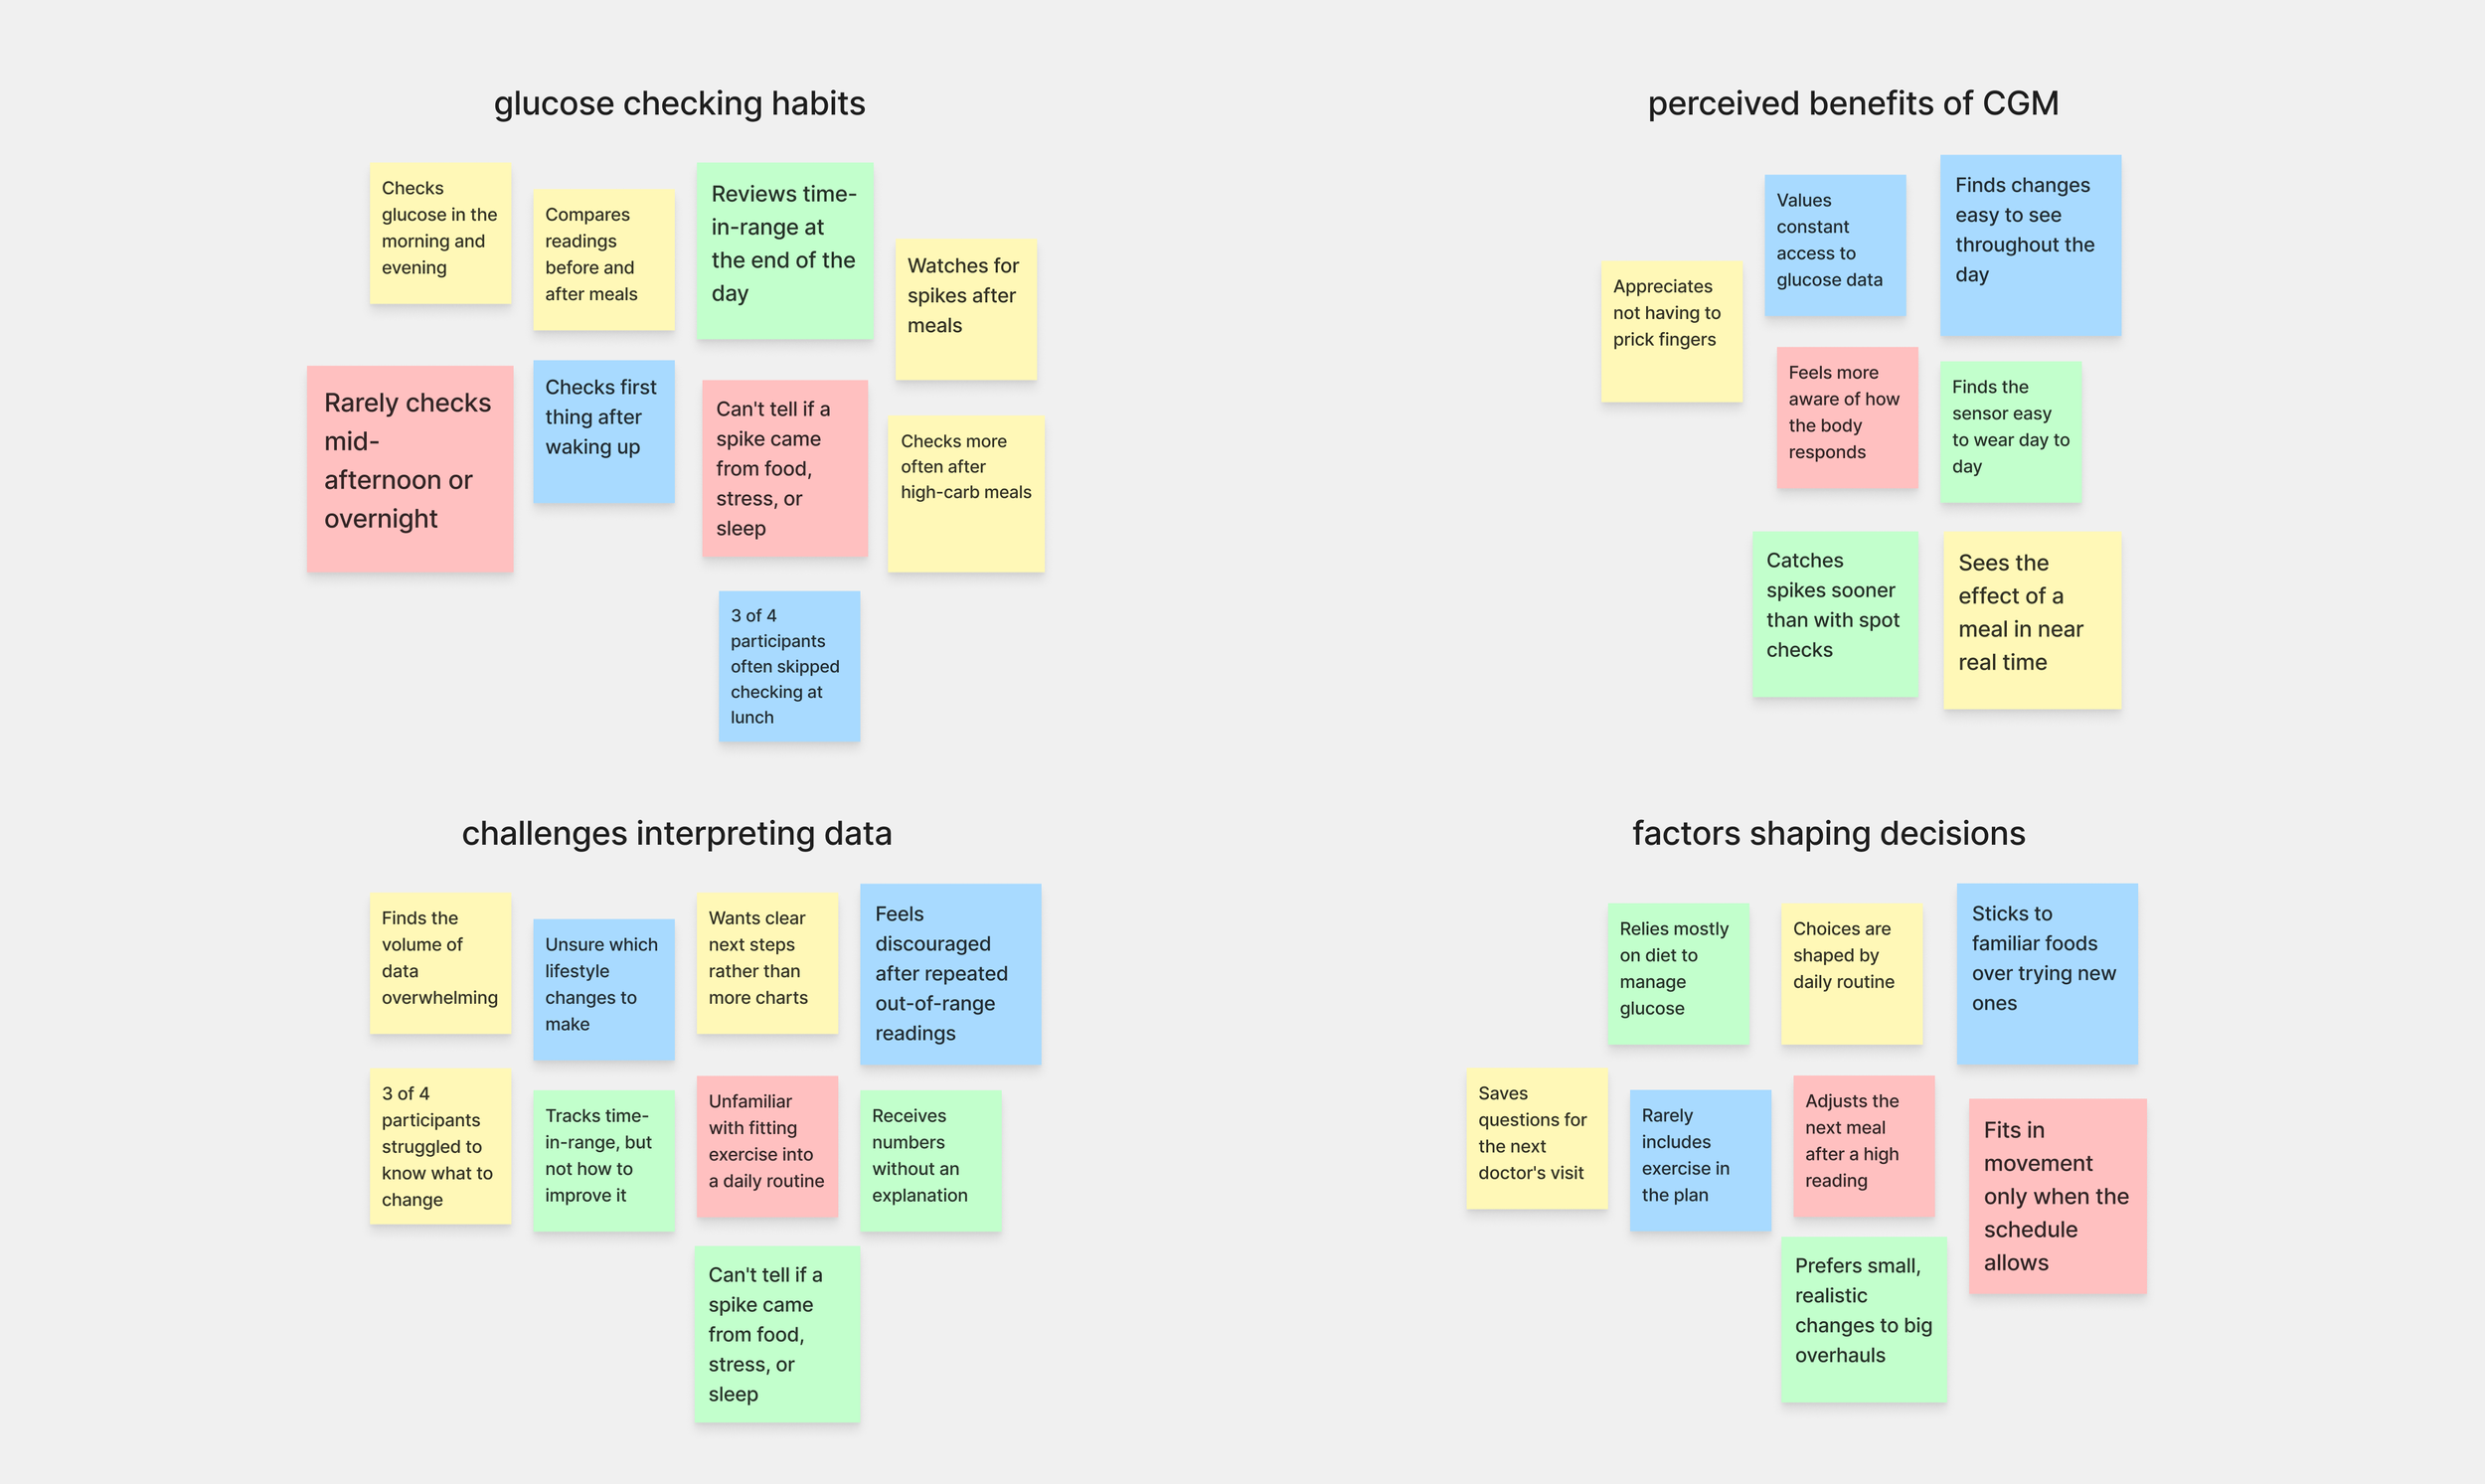
Based on interviews and diary studies with CGM users, I learned that:
Most CGM users can see their data, but not what to do with it.
This held true for 3 of 4 participants, who struggled to know which lifestyle changes to make.
CGM users tend to check their glucose around meals, not throughout the day.
Participants checked in the morning and evening, and three often skipped lunch.
Most users treat time-in-range as their main measure of progress.
This was true for all four participants, yet none knew how to stay in range more often.
Empathizing
Fostering Empathy Using Personas & User Journey Maps
48 / Boston / Accountant
Sarah

"I can see my numbers all day, but I never know what to do about them."
About
Sarah is an accountant who recently started using a CGM to stay ahead of her diabetes risk. She checks it every morning and after dinner, and she loves not having to prick her finger. But between long desk days and cooking family dinners for her husband and two kids, she rarely has time to study the numbers. With so much data on screen, she can't tell which numbers matter or what to change.
Needs
To understand a reading at a glance
A clear next step in the moment
Guidance that fits her routine
Frustrations
Too much data, not enough direction
Unsure how to stay in range more often
52 / Quincy / High school teacher
Michael

"I know my time-in-range every night. I just don't know how to improve it."
Michael is a high school teacher who has used a CGM for several years. He checks before and after meals, and logs his time-in-range at the end of each day before bed. With a packed teaching schedule and family dinners built around familiar meals, he manages mostly through diet. Fitting exercise into such a busy routine feels unfamiliar, and he isn't sure where it would even go.
About
Habit-based suggestions
Movement included, not just food advice
Guidance that fits the foods he already eats
Needs
Frustrations
Often skips checking at lunch
Knows his time-in-range, but not how to raise it
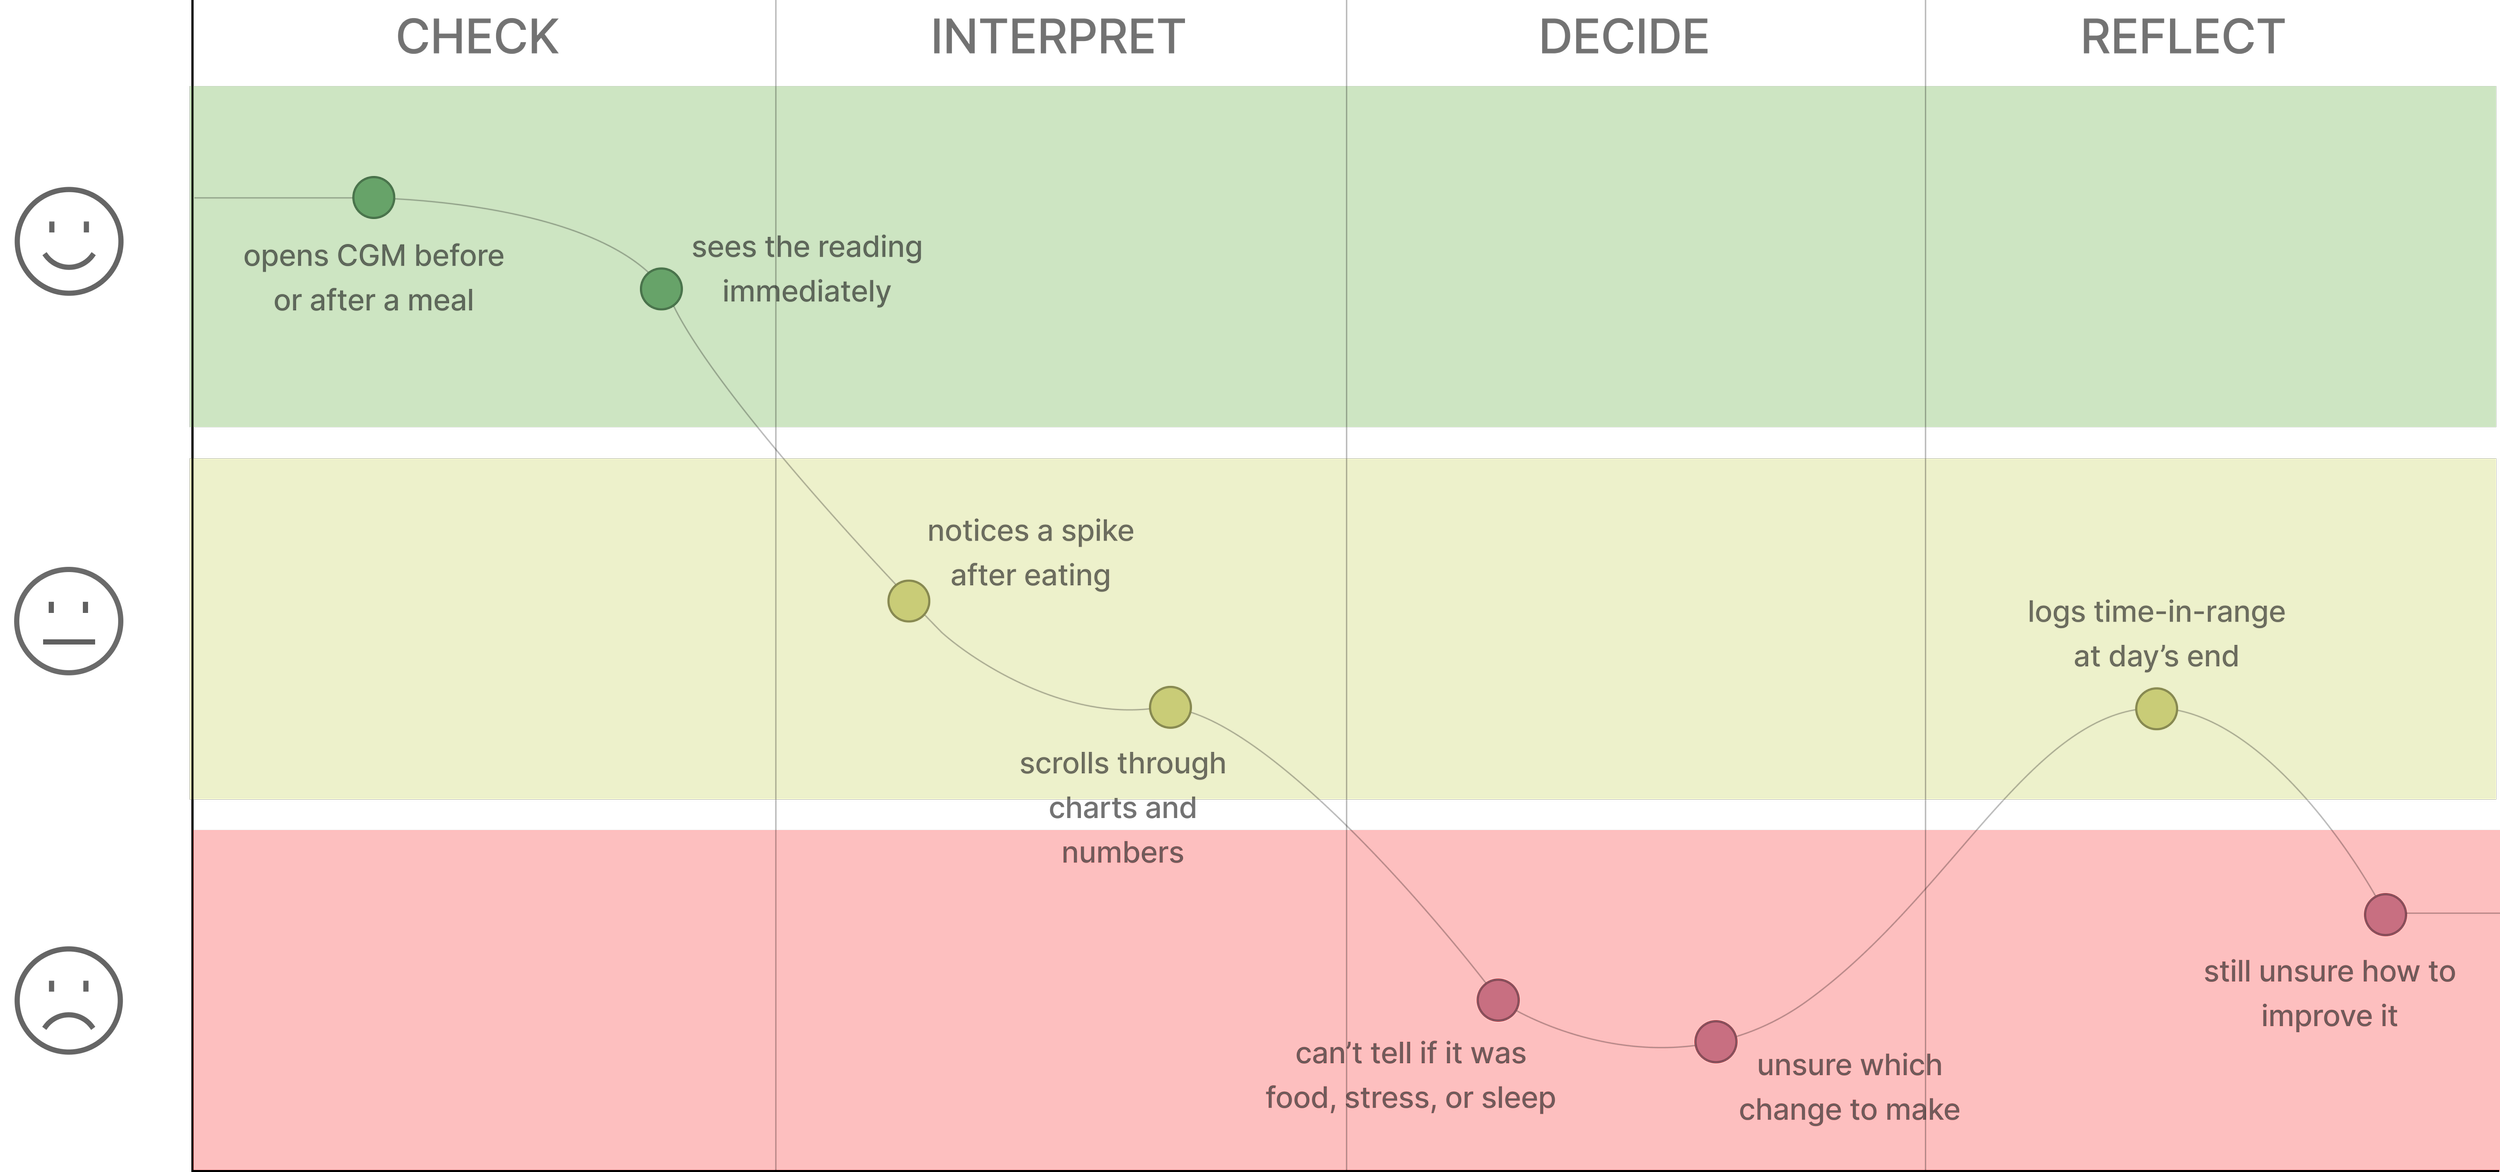
To put myself in the shoes of my personas, I mapped a typical day of CGM use, from checking a reading to deciding what to do about it. The map shows that the low point isn't seeing the number. It's the moment right after, when users have to figure out what to change on their own.
Competitive Breakdown
Conducting a competitive audit to find where glucose data stops being useful.

Lastly, I conducted a competitive audit on four apps people already use to track their glucose, food, and health: MyFitnessPal, Glucose Buddy, Dexcom, and FreeStyle LibreLink. I looked at what each does well, where users hit friction, and how well each helps people act on their data. I found that:
1. Most apps lead with logging, not interpretation.
2. Insights are often locked behind premium.
3. Feature-heavy apps overwhelm users.
4. Simple indicators work.
03. DESIGN
Ideation
Problem Framing & Feature Prioritization
After conducting my research, I felt better equipped to create something purposeful: an app that translates raw CGM readings into plain-language insight, surfaces patterns in everyday habits, and diverges from the typical data-heavy glucose dashboard by catering to people who can see their numbers but aren’t sure what to do with them. Dr. Nguyen’s (from ADWC) feedback helped sharpen this direction, narrowing our focus from older glucose monitor users to CGM users, where the gap between data presentation and interpretation is most apparent.
To anchor the design stage, I distilled the research into a problem statement and a guiding question: How might we simplify and re-direct the complex glucose monitoring data interpretation process so that CGM users feel more engaged with their data and more encouraged to make sustainable changes to their dietary habits?
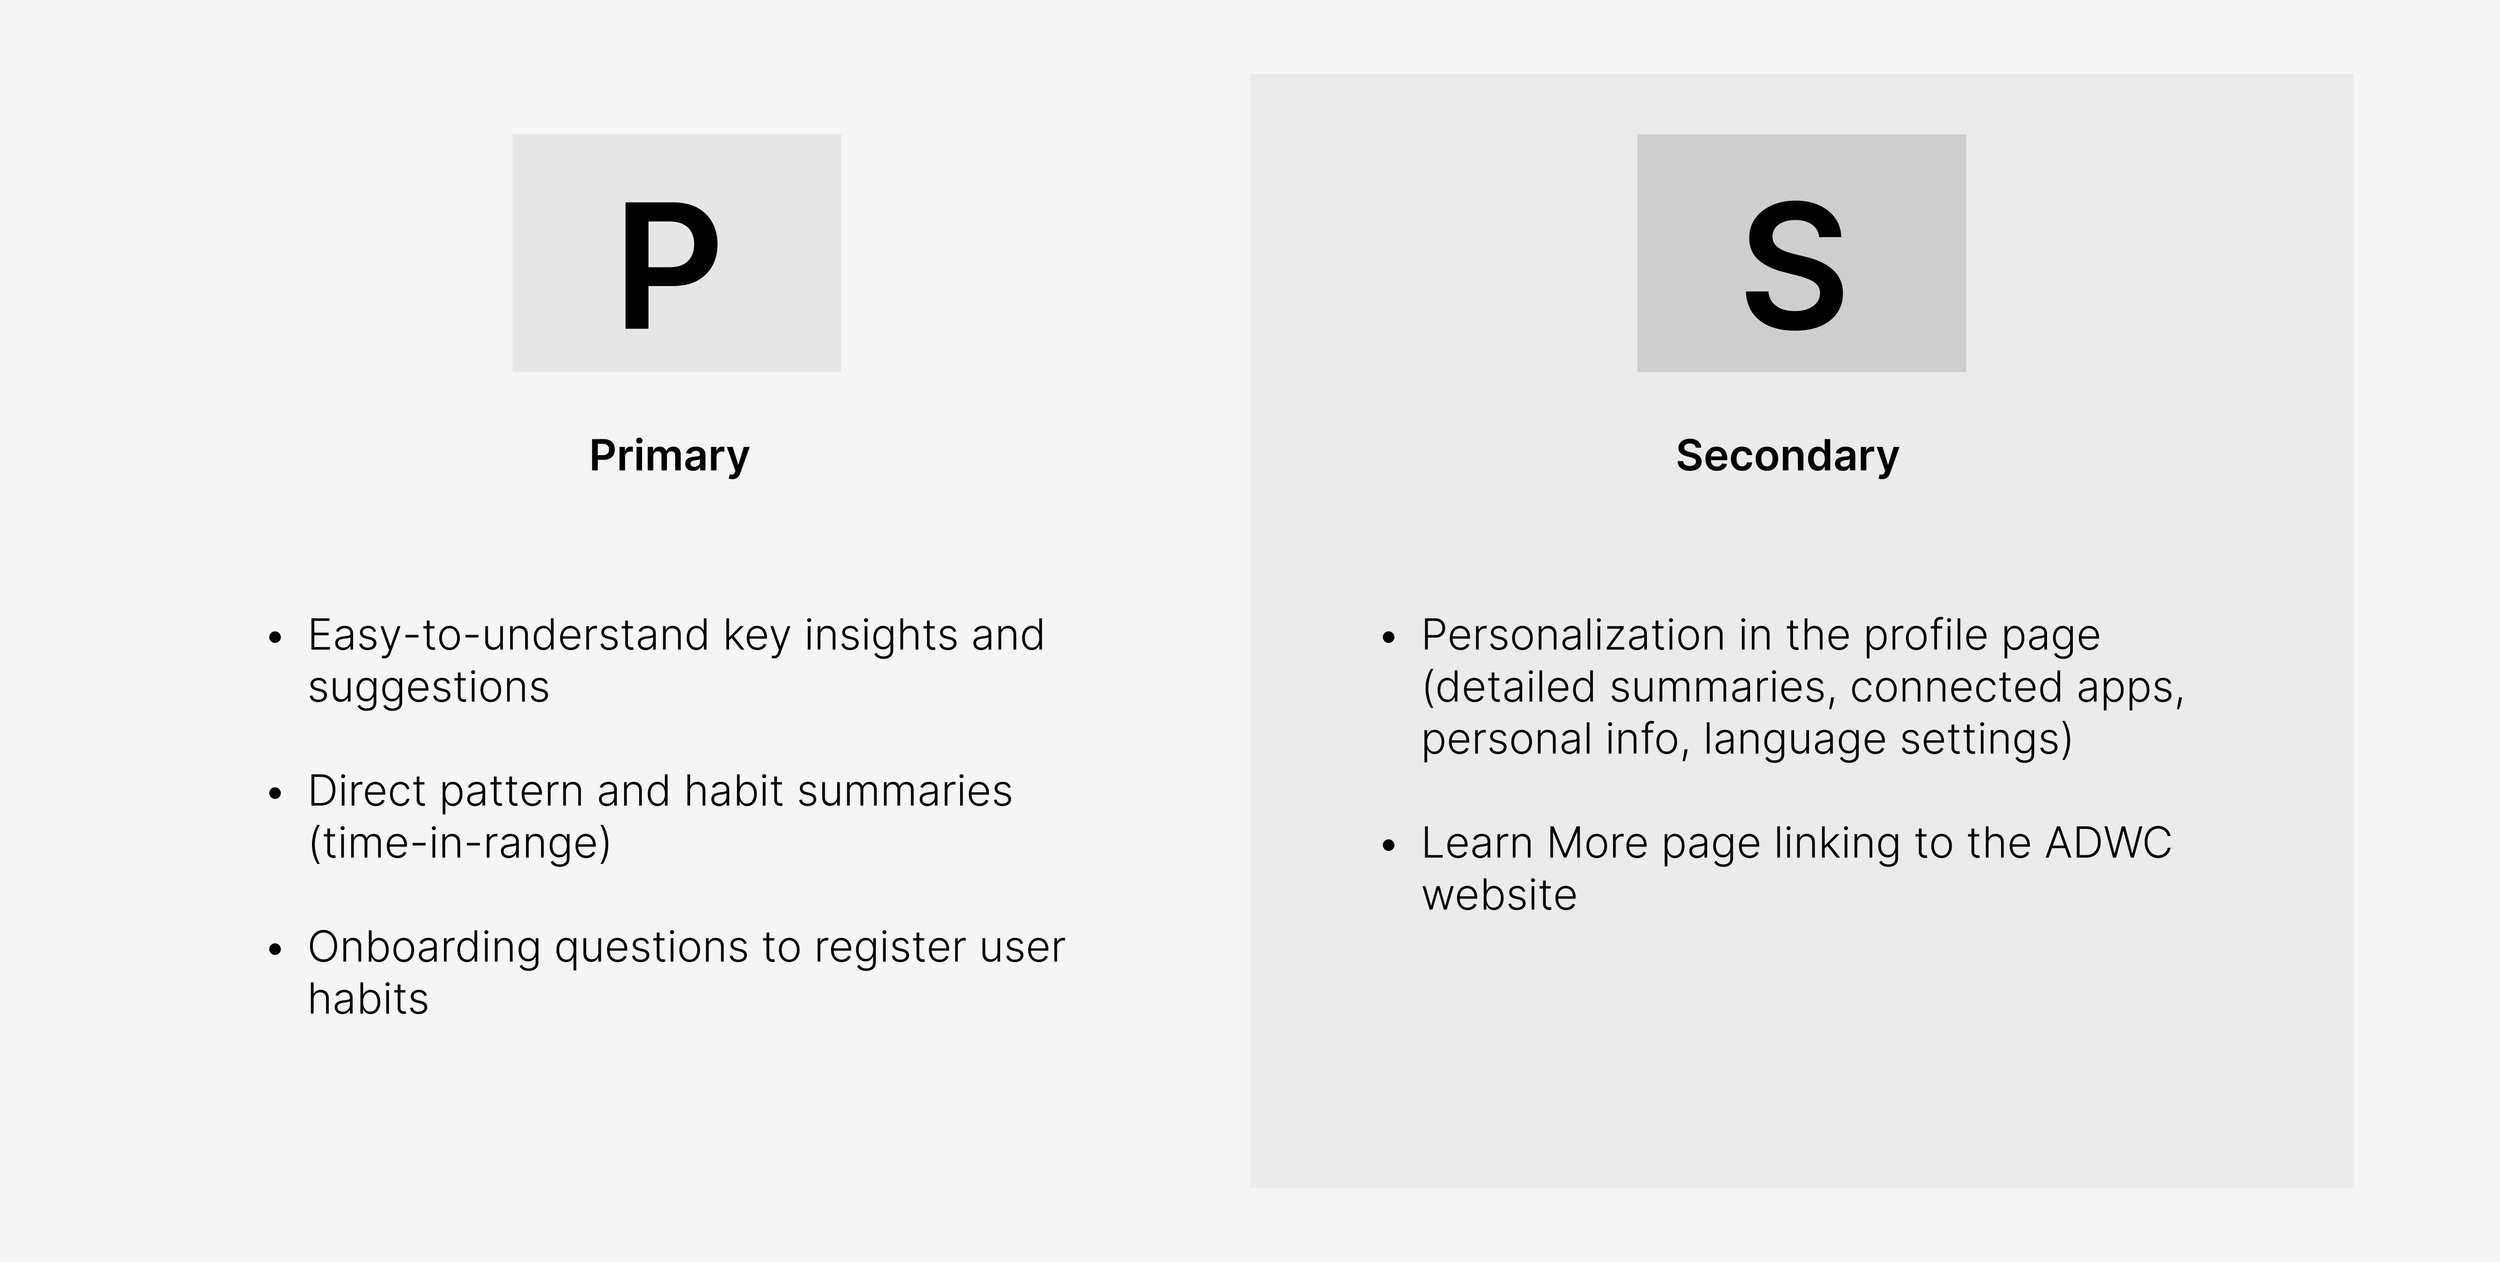
Next came prioritization. Because users consistently told us that raw numbers weren’t helpful on their own, I organized features into primary and secondary tiers, weighing each against its value to the user experience. This gave me a clear focus on which key features to address first when I began wireframing.
User Flows
Mapping the User Flows
With priorities set, I worked with Julia to map three core flows: onboarding, connecting a CGM app, and the daily check-in. The daily check-in became the heart of the experience. The app checks whether blood glucose is in range, then shows an analysis if it is or a suggestion if it isn’t. After the user completes the action, the app logs it, checks for CGM change, and closes with a reinforcement screen.
Onboarding/Connection


Daily Check-In

Wireframing
Designing the Initial Concepts
With the user flows mapped, I turned my ideas into greyscale wireframes to explore their viabilities and narrowed in on the designs I liked. Here are the final wireframes I created for the main screens, built around one idea: a simple insight and a suggestion, catered to the user’s needs.
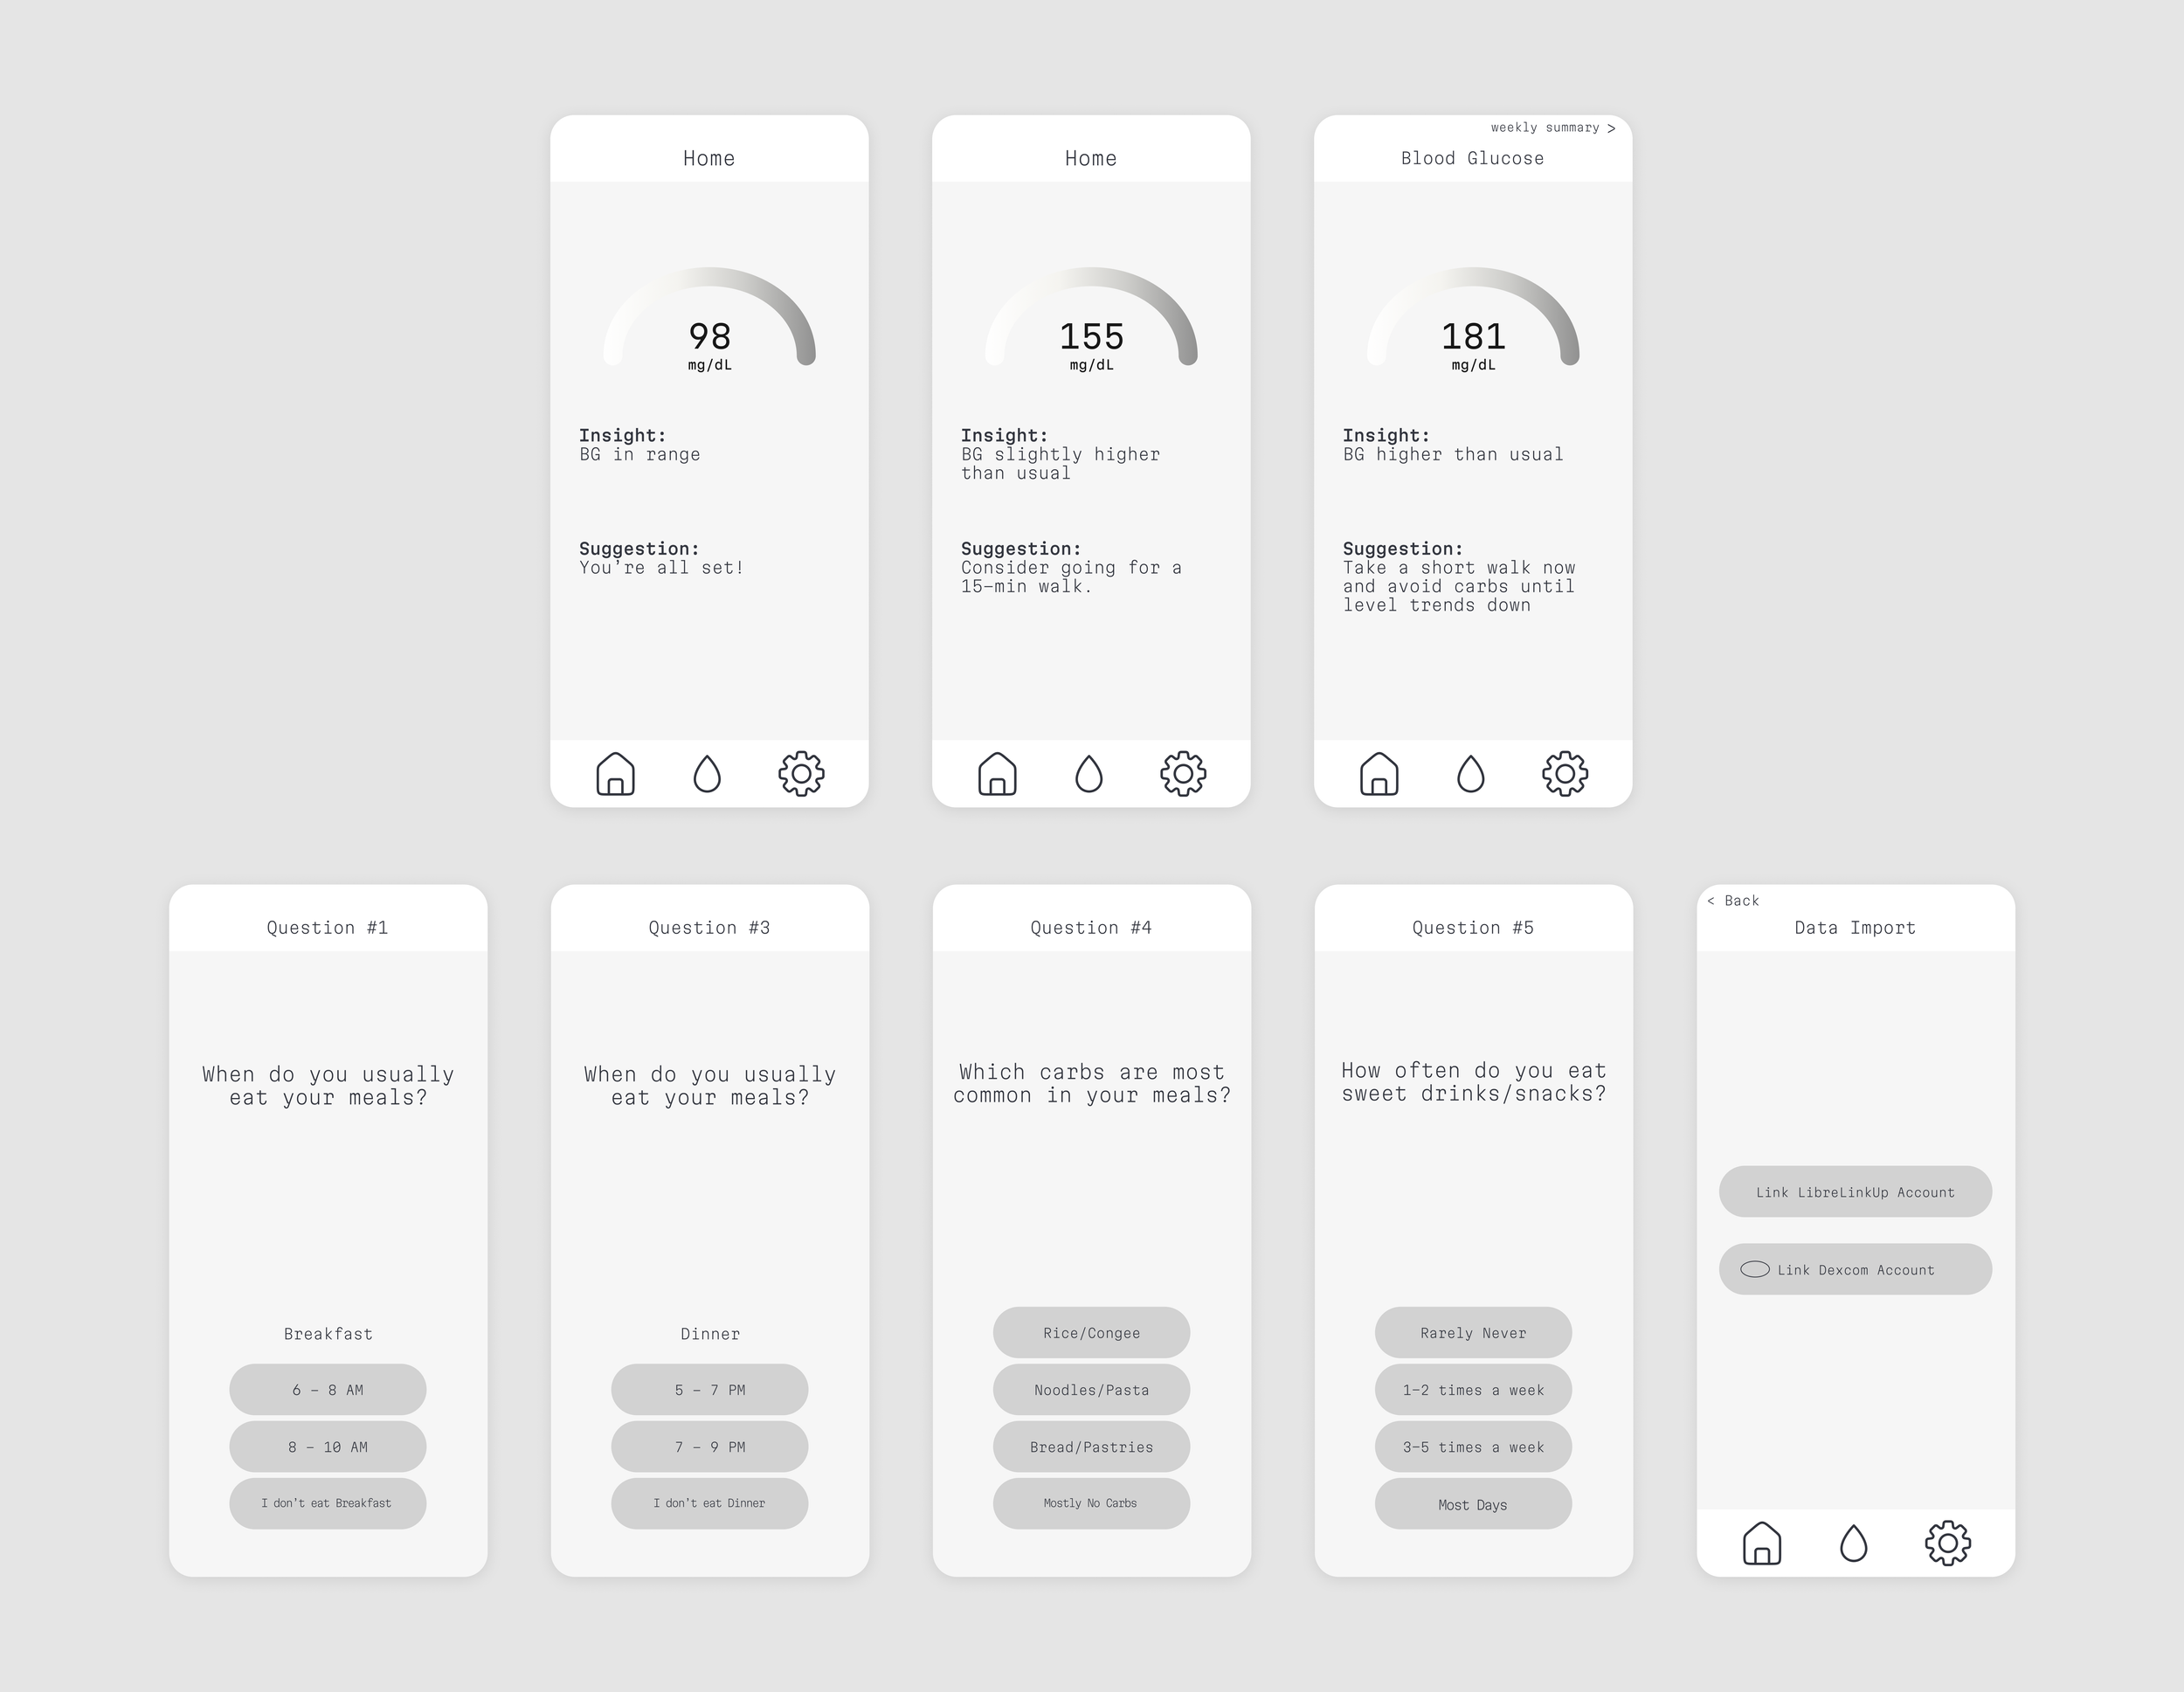
User Feedback & Design Revisions
Expand the one-line insight into an explanation of what the reading means
Explain possible causes when glucose spikes, such as a larger meal, or low movement after eating
Add a Patterns & Habits page, so each insight connects to users’ broader habits
Add a welcome message with a brief description of the app
Add a prompt when users try to skip, reminding them to connect their CGM data
Explain on the connection screen that CoreCare analyzes trends over time and keeps data private and secure
Stop and Check: Is The Design Making Sense of the Data?
1. Users appreciated the home screen’s suggestion, but wanted to understand the story behind it.
2. Onboarding questions felt unexplained, and users were inclined to skip them.


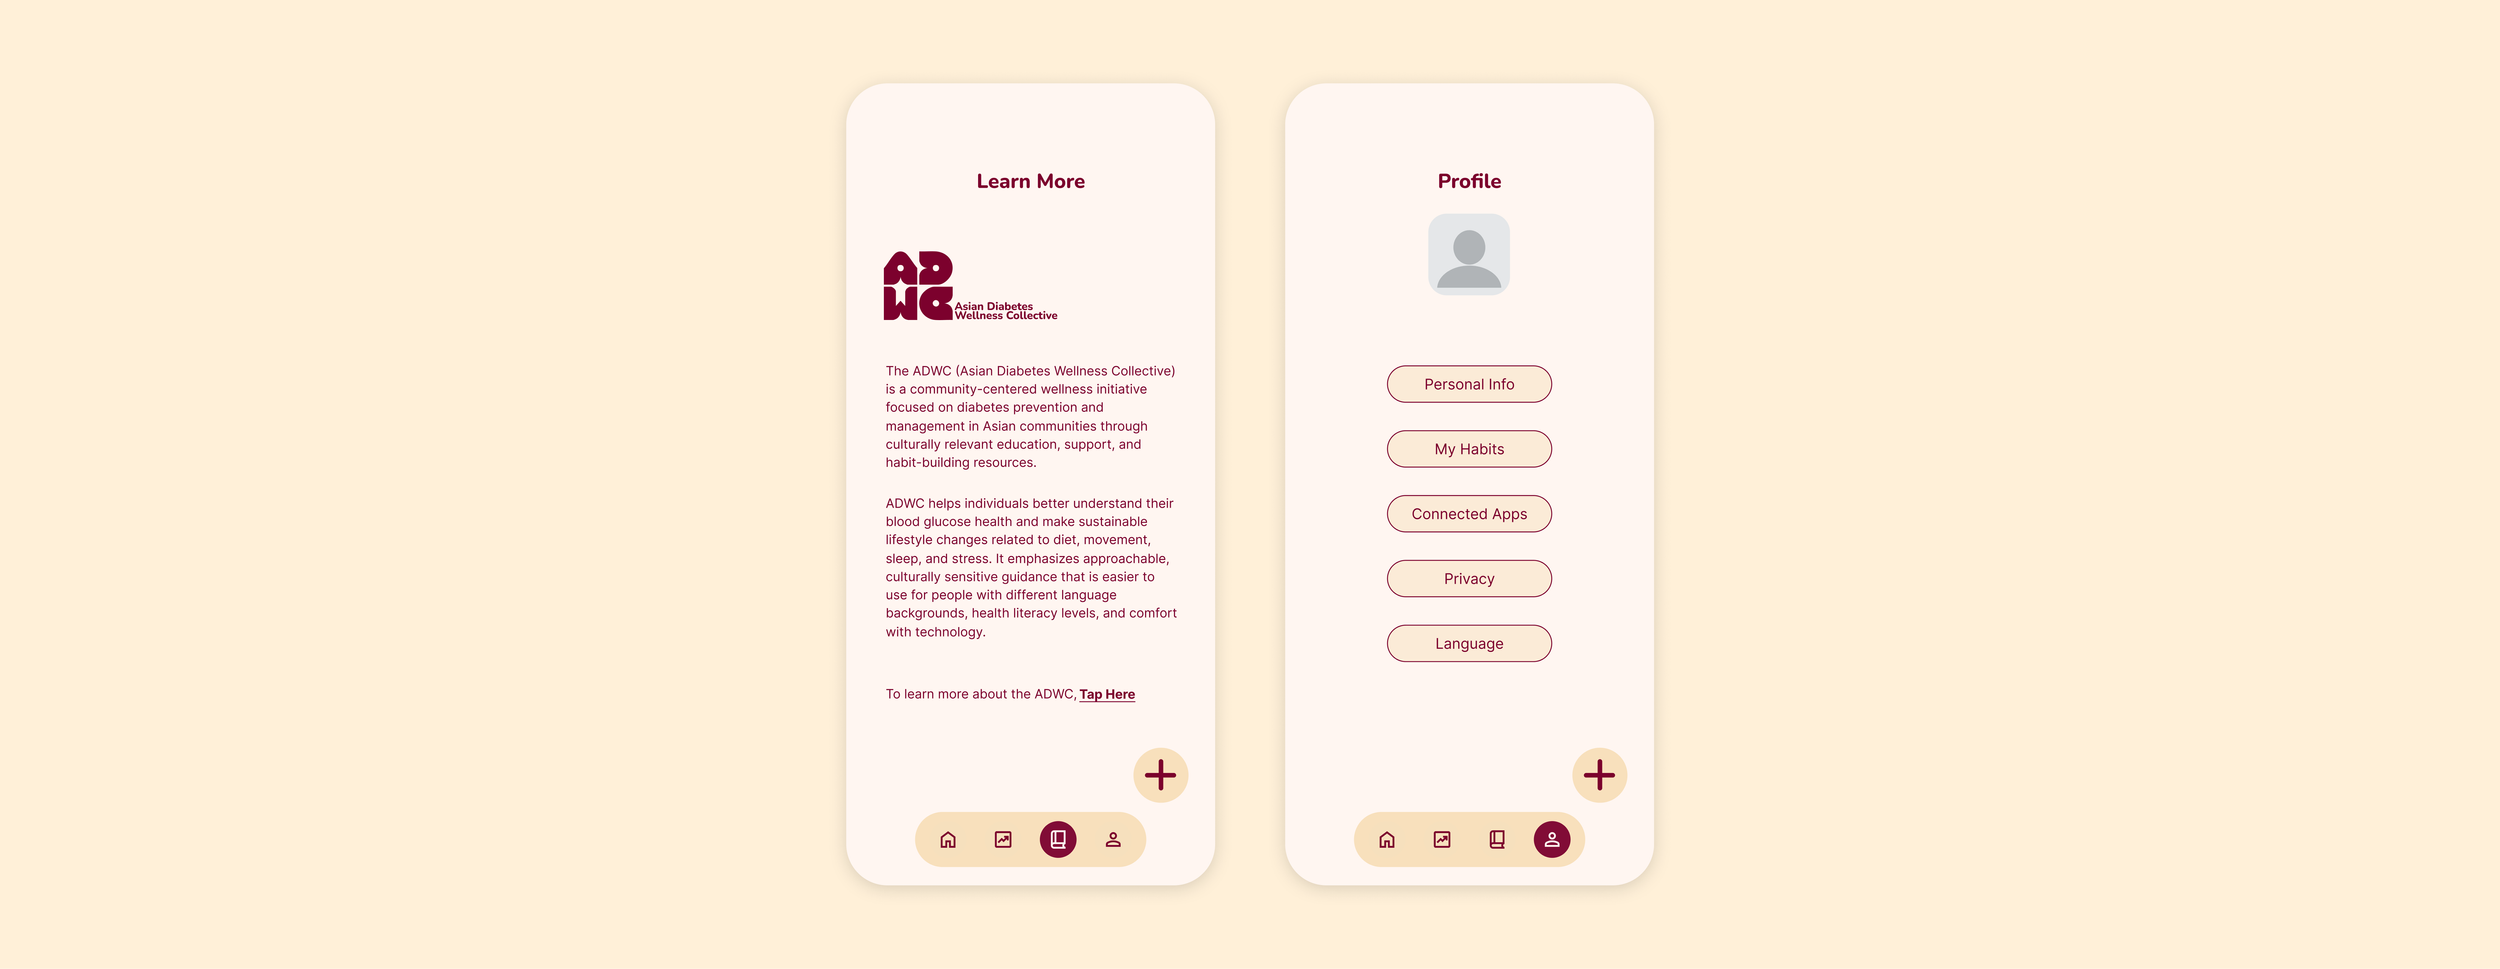
Add a Learn More page introducing the Asian Diabetes Wellness Collective
Add a link directly to the ADWC website to provide easy access to users, encouraging to learn more about diabetes awareness
Place Learn More as its own tab in the main navigation
3. ADWC members saw an opportunity to connect users to diabetes education inside the app.

With the low-fidelity prototype complete, I conducted a round of usability testing with school peers and their older family members, and gathered feedback from ADWC members to validate whether my designs were working as intended. Since the prototype used sample data rather than a live CGM connection, I focused on comprehension and flow. I grouped the feedback into three categories and devised action points that shaped the final design.
Mockups & Prototyping
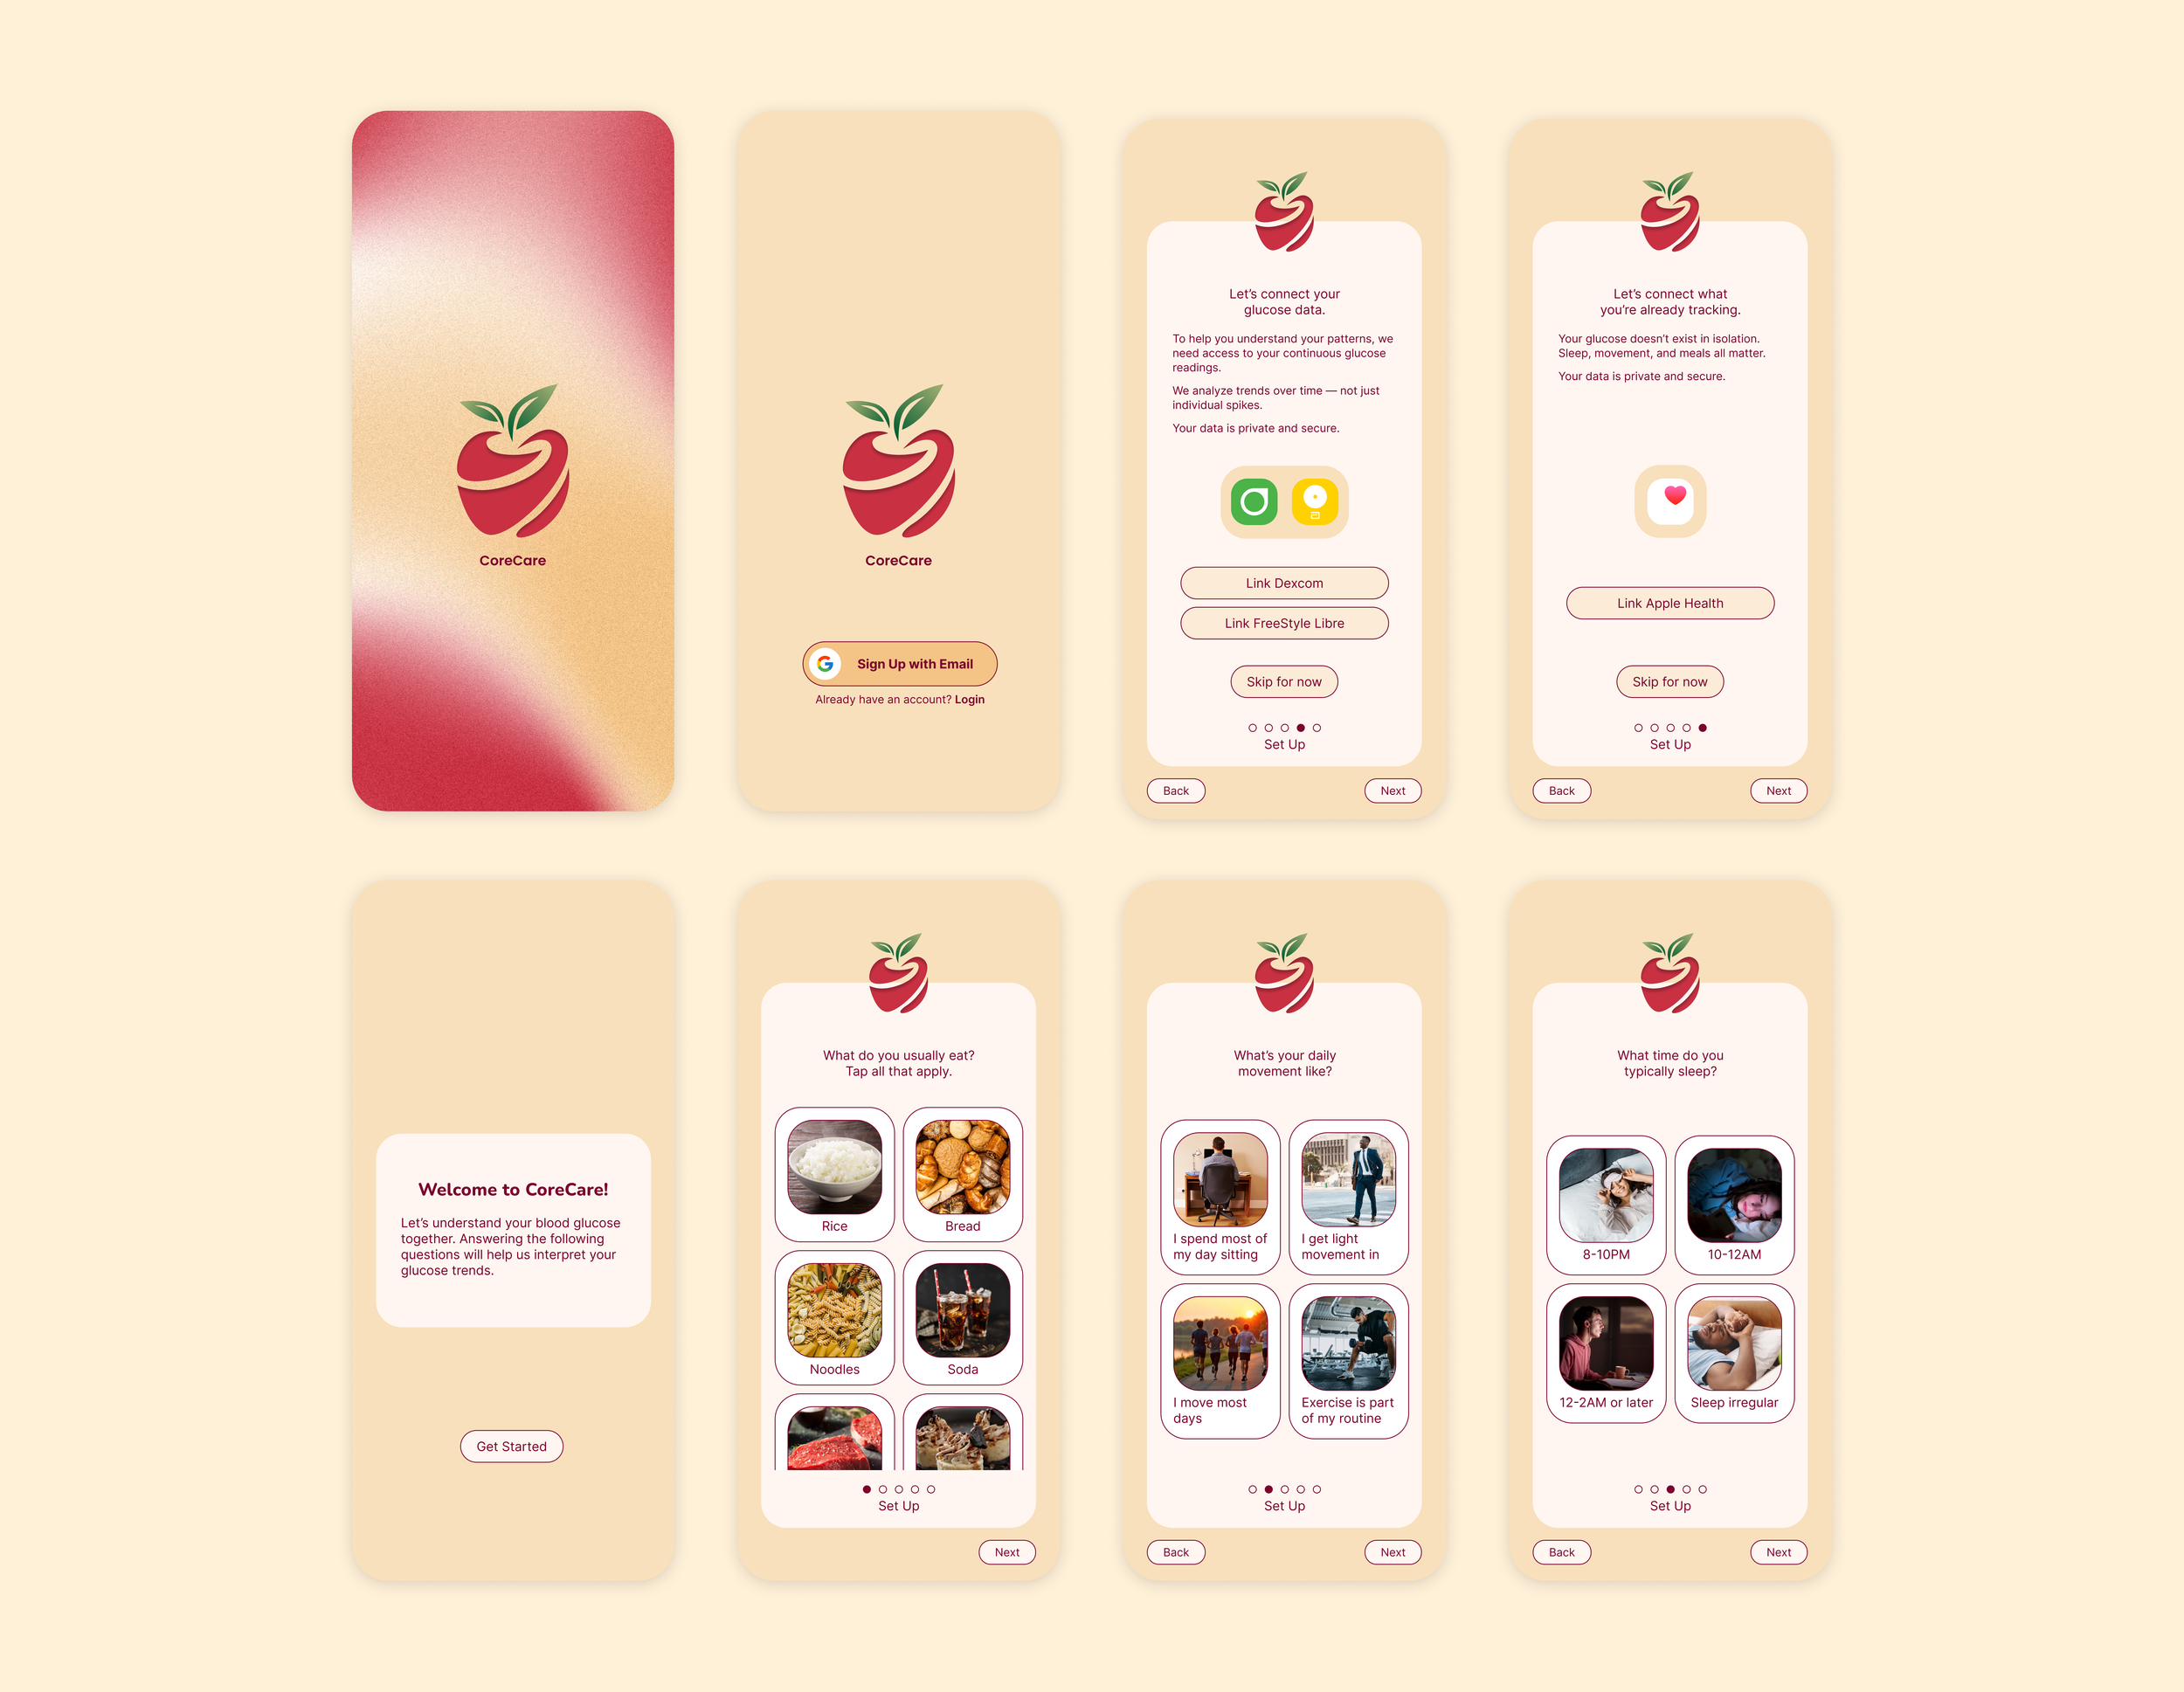
Using the insights from user testing at the forefront of my design decisions, I worked with Julia to create an iteration of our high-fidelity prototype on Figma. The design pairs a warm, approachable palette with a clear type system, so that glucose insights feel supportive rather than clinical.
High Fidelity Design: Onboarding & Connection
Learn More
Design System
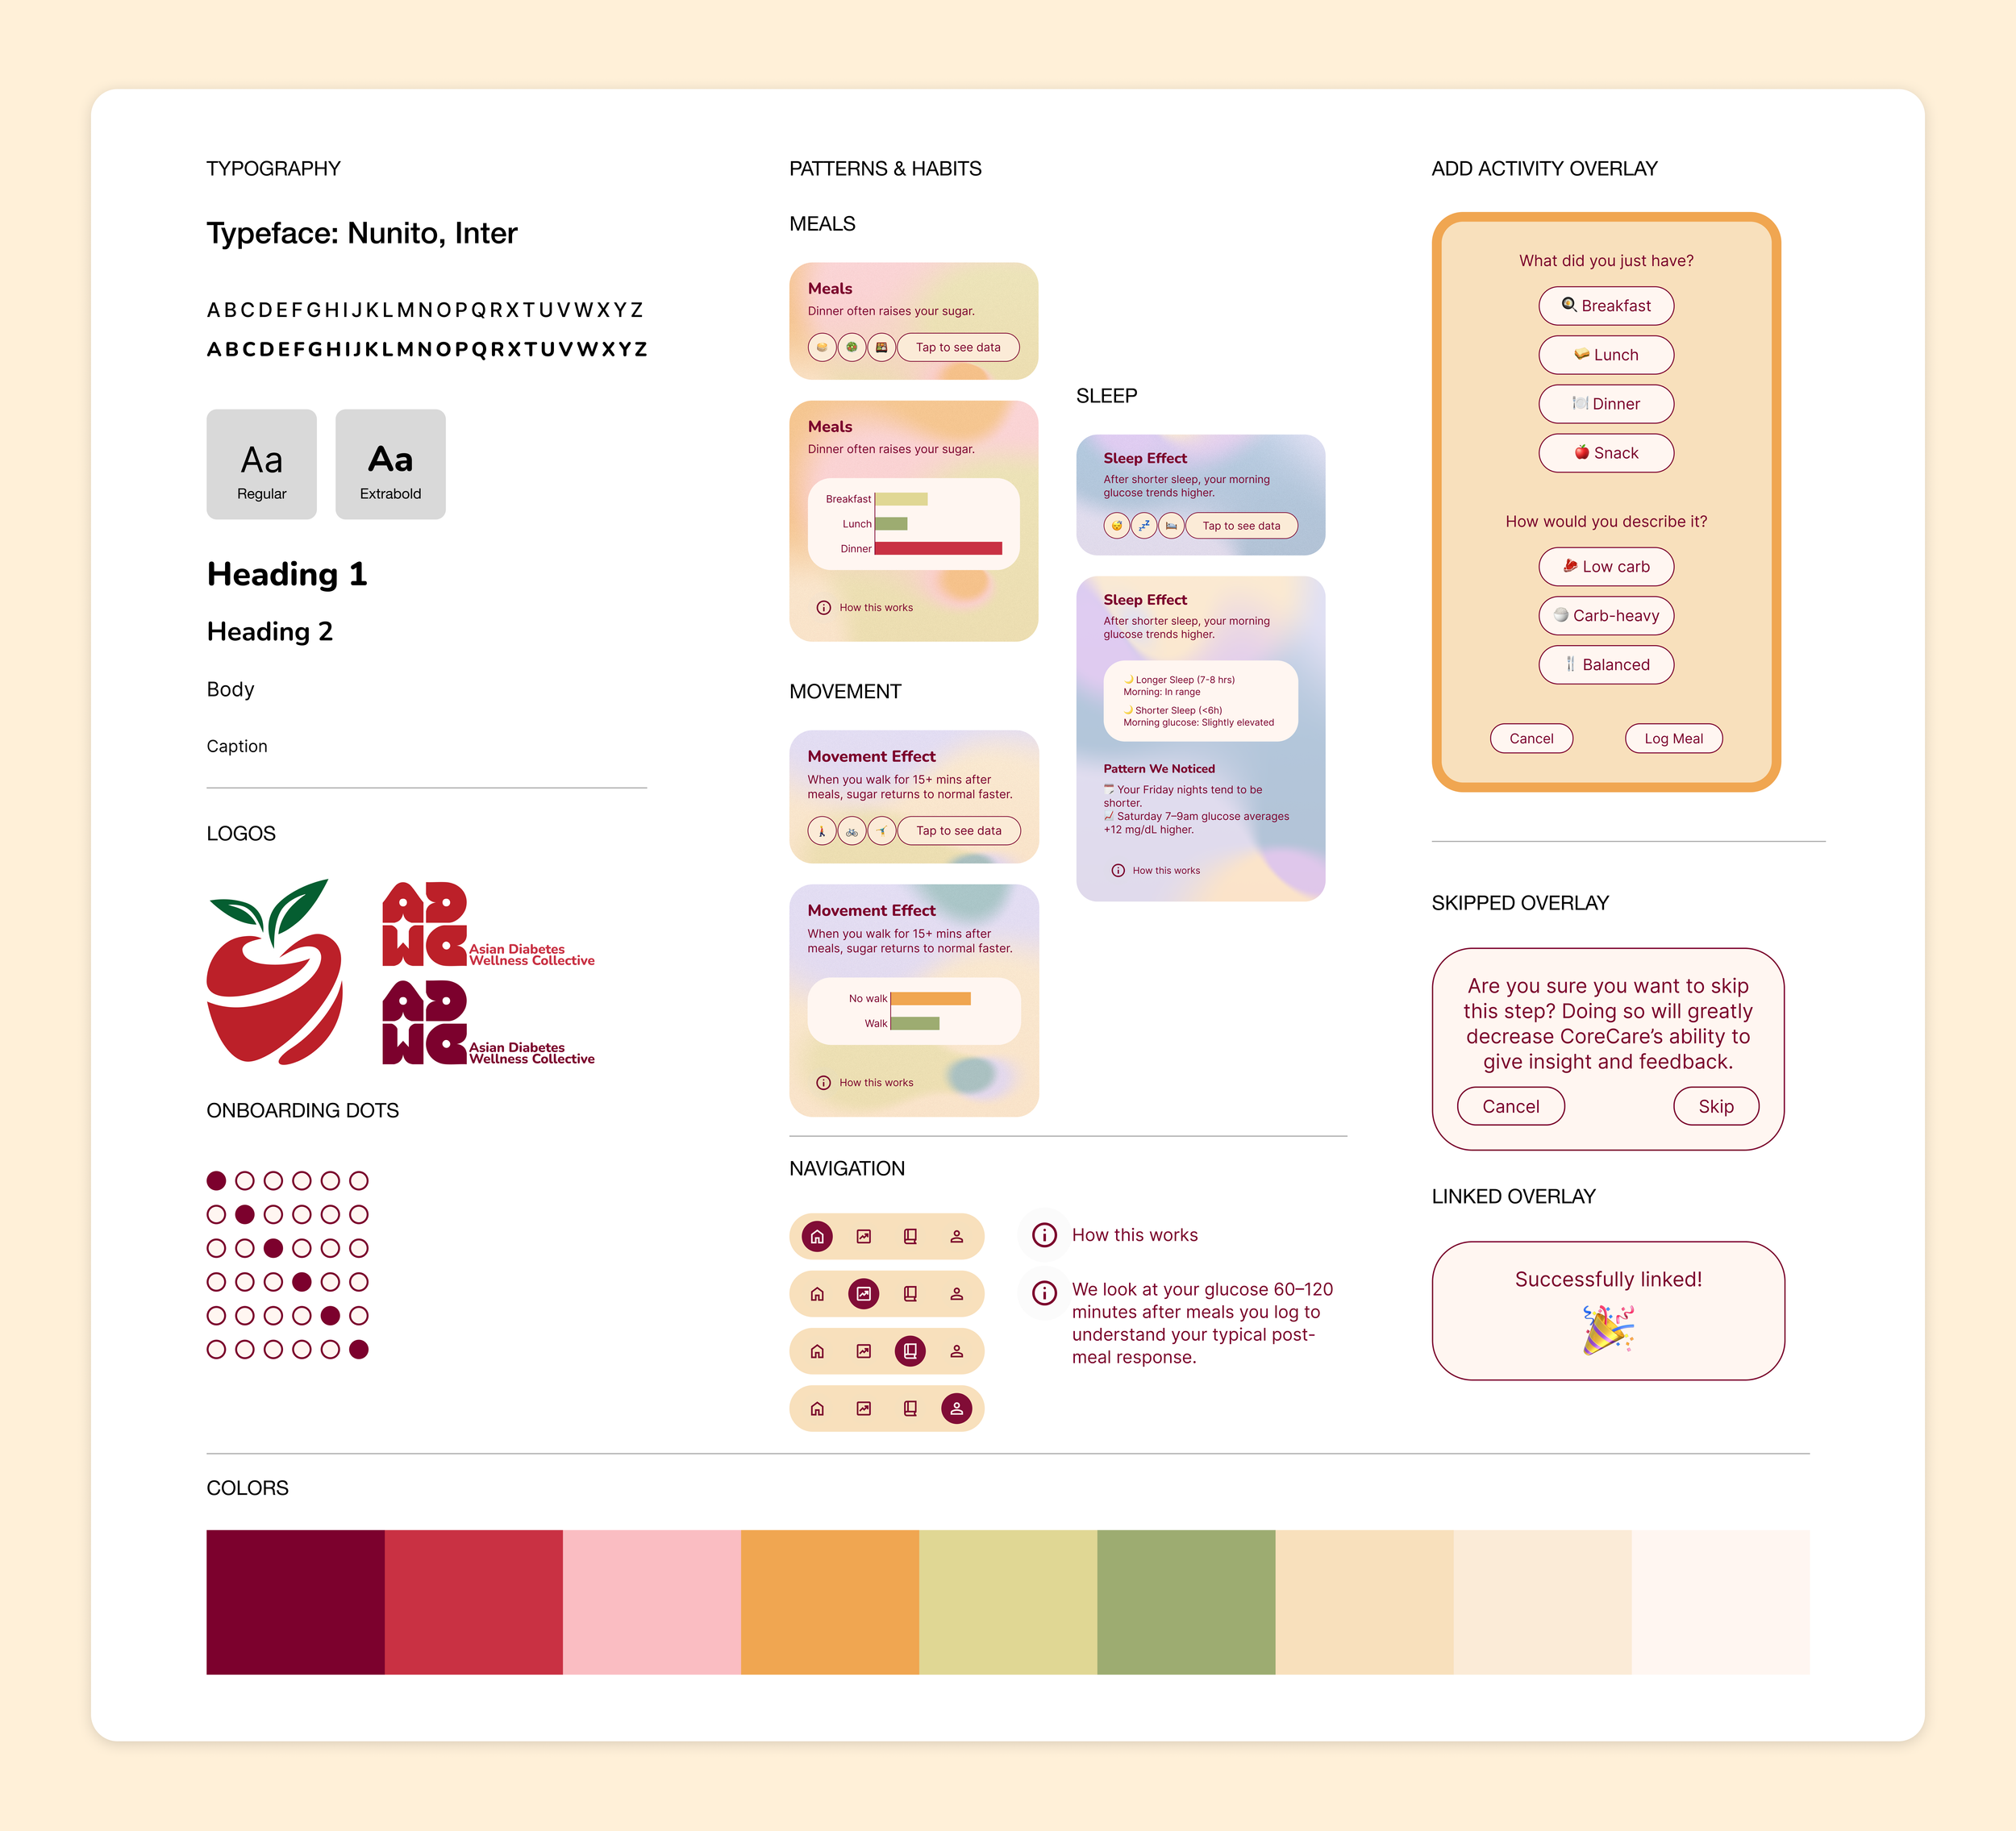
Daily Check-In Patterns & Habits
04. PROTOTYPE
05. TAKEAWAYS
Clarity is earned through the user’s experience.
I began this project assuming that a layout logical to me would be logical to users, and feedback proved otherwise. This reframed wireframing as a tool for identifying usability issues early in the process, before visual refinement—design choices were defined by user behavior. Because our testing was limited to a small group using sample data, the next step would be usability testing with a live CGM connection to assess how the design performs with real readings.
Strong UX comes from a repeatable process, not a “good screen.”
Our research showed that users could read their glucose data but struggled to act on it, and that insight carries more value than raw data. This led me to prioritize usability, interpretation cost, and next-step guidance over visual completeness. Since the prototype is not connected to a real CGM, the accuracy of its recommendations remains unverified. Collaborating with healthcare experts and refining the app’s logistical flow would be essential to making the concept dependable.
A concept develops best alongside its community.
CoreCare is a design concept, and my focus was on validating the idea rather than delivering a medical product. Its direction was shaped by the mission of the Asian Diabetes Wellness Collective (ADWC), which works to raise awareness, drive meaningful change, and educate people in their everyday lives. The most meaningful next step would be to continue the work with ADWC to develop the concept further for the community it was designed to serve.